- Blog
- Measure Angular Render Time
Measure Angular Render Time (2024)
Performance matters.
If your application performance is acceptable today, consider adding benchmarks and measuring the current performance to ensure that your performance continues to meet your definition of acceptance. However, if you application performance is not acceptable today, then let's get to work!
Lab vs Field Measurements
It's important to note that there are two different strategies for measuring performance:
- Lab Measurements: These are measurements taken in a controlled environment, such as a development or staging environment.
- Field Measurements: These are measurements taken in the real world. We're talking prod, baby!
Each strategy has its own set of tools, and will often report different results. This is a good thing!
Lab and field measurements can vary for a number of reasons, such as:
- network conditions,
- device capabilities,
- device screen size,
- whether the user is logged in or not,
- user behavior,
- and more.
Angular DevTools
When it comes to measuring Angular render time in a lab environment, I recommend using Angular DevTools.
Angular DevTools is a Chrome extension that provides a visual representation of your Angular application's component tree and change detection graph. It also provides a way to profile your application's performance.
I find the "Profiler" tab to be the most useful for measuring Angular render time.
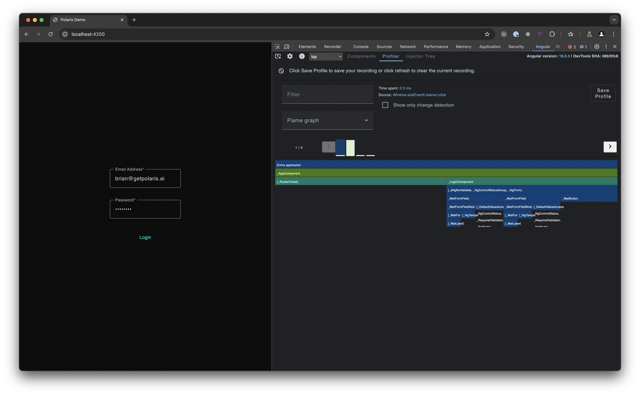
Let's break this down:
- I like to use the "Flame Chart" view. This shows a horizontal timeline of the execution of change detection, with the width of each bar representing the time spent in that function.
- Once you create a recording, you can choose to filter or select a specific change detection "cycle" or "frame".
- Clicking on a specific change detection cycle or frame displays the flame chart of the function executions for that frame.
When using the Angular DevTools Profiler, I like to focus on the following:
- Change detection cycles / frames that have the longest duration.
- Functions that are taking the longest to execute.
- Functions that are being called the most frequently.
The flame charts enable me to quickly identify the functions that are causing bottlenecks in my application.
From there, I make my way to the Chrome DevTools "Performance" tab to dig deeper into the performance of the functions that are causing bottlenecks.
Real User Monitoring
When it comes to measuring Angular render time in a field environment, I recommend using a real user monitoring tool.
Polaris provides real user monitoring -- sometimes called a RUM tool. Using the Polaris Angular SDK, we can measure the rendering performance of an Angular application as experienced by our "real" users.
The Polaris Angular SDK provides a way to measure the following:
- Angular component render time.
- Core Web Vitals
- API performance and reliability
- Custom performance metrics
- User actions and events
Measure First Render
One of the most important metrics to measure is the time it takes for the first render of your Angular application.
This is the time it takes for the user to see something on the screen after they've navigated to your application.
import { measureFirstRender } from '@getpolaris.ai/sdk-angular';

export class AppComponent {
  constructor() {
    measureFirstRender();
  }
}
Let's review the code above:
- We import the
measureFirstRenderfunction from the Polaris Angular SDK. - We call the
measureFirstRenderfunction in theAppComponentconstructor.
The measureFirstRender function measures the time it takes for the first render of your Angular application.
You can invoke the measureFirstRender function in any component's constructor() function to measure the time it takes to render that component for the first time.
Measure Component Render Time
Another important metric to measure is the time it takes for a specific Angular component to render.
Let's look at an example.
import { measureRender } from '@getpolaris.ai/sdk-angular';

export class AppComponent {
  constructor() {
    measureRender();
  }
}
Let's review the code above:
- We import the
measureRenderfunction from the Polaris Angular SDK. - We call the
measureRenderfunction in the component'sconstructor()function.
You can invoke the measureRender function in any component's constructor() function to measure the time it takes to re-render that component.
Indicators of Performance
The next step is to deploy your application to production. 🚀
Once Polaris starts collecting measurements, we'll create two performance indicators for your Angular application:
<${selector}> / First Render: indicator of the duration of the component's first render.<${selector}> / Render: indicator of the duration of the component's subsequent renders.
We'll also create the following performance objectives for your Angular application:
<${selector}> / First Render: less than 16ms in the 90th percentile.<${selector}> / Render: less than 16ms in the 90th percentile.
The 90th percentile is a good indicator of the performance that most users will experience. And, 16ms is the target time for a frame to render at 60 frames per second.
Conclusion
Measuring Angular render time is an important part of ensuring that your application is performing well.
By using Angular DevTools in a lab environment and Polaris in a field environment, you can measure the performance of your Angular application and identify areas for improvement.