Let's get started
- Install and configure the Polaris SDK.
- Instrument your app to send measurements to Polaris.
- Create indicators of performance and reliability.
- Create goal-based objectives.
- Configure webhooks to receive notifications when objective thresholds are exceeded.
Install the Polaris SDK
System requirements:
- Node.js 18 or later
- macOS, Windows (including WSL), and Linux are supported.
npm i -S @getpolaris.ai/sdk @getpolaris.ai/sdk-angular
Configure the SDK
To configure the SDK, you will need your app’s API Key. You can find the API Key by going to your app in Polaris and clicking on Settings.
import { providePolaris } from '@getpolaris.ai/sdk-angular';

bootstrapApplication(AppComponent, {
  providers: [
    providePolaris({
      apiKey: API_KEY,
    }),
  ],
});
If your Angular application is module based, you can configure the SDK with the PolarisModule.
import { PolarisModule } from '@getpolaris.ai/sdk-angular';

@NgModule({
  imports: [
    PolarisModule.forRoot({
      apiKey: API_KEY,
    }),
  ],
})
export class AppModule {}
Measure Initial Render Time
Next, measure the time it takes to render a component for the first time.
import { measureFirstRender } from '@getpolaris.ai/sdk-angular';

export class AppComponent {
  constructor() {
    measureFirstRender();
  }
}
Let's review the code above.
- We import the
measureFirstRenderfunction from the@getpolaris.ai/sdk-angularpackage. - We call the
measureFirstRenderfunction in the constructor of theAppComponent.
You can invoke the measureFirstRender function in any component's constructor() function to measure the time it takes to render that component for the first time.
Measure Re-render Time
Next, let's measure the time it takes to re-render a component.
import { measureRender } from '@getpolaris.ai/sdk-angular';

export class AppComponent {
  constructor() {
    measureRender();
  }
}
Let's review the code above.
- We import the
measureRenderfunction from the@getpolaris.ai/sdk-angularpackage. - We call the
measureRenderfunction in the constructor of theAppComponent.
You can invoke the measureRender function in any component's constructor() function to measure the time it takes to re-render that component.
Measure Critical Workflows
We want to measure the performance of a critical workflow in our app, such as the authentication flow.
First, we need to create an instrument in Polaris using the getInstrument() method on the PolarisService class.
export class AppComponent {
  const polaris = inject(PolarisService);

  onAuthenticate() {
    const instrument = polaris.getInstrument('auth-flow');
    instrument.start();
  }
}
Let's review the code above.
- We import the
PolarisServiceclass from the@getpolaris.ai/sdk-angularpackage. - We call the
getInstrument()method on thePolarisServiceclass to create an instrument with the nameauth-flow. - We call the
start()method on the instrument to start measuring the performance of the authentication flow.
Next, we need to stop the instrument when the authentication flow is complete.
export class DashboardComponent {
  const polaris = inject(PolarisService);

  ngAfterViewInit() {
    const instrument = polaris.getInstrument('auth-flow');
    instrument.done())
  }
}
We call the done() method on the instrument to stop measuring the performance of the authentication flow.
Measure API Error Rate
Our Angular SDK provides an interceptor that measures the error rate of your API.
import { polarisInterceptor, providePolaris } from '@getpolaris.ai/sdk-angular';

export const appConfig: ApplicationConfig = {
  providers: [
    provideHttpClient(withInterceptors([polarisInterceptor]), withFetch()),
    providePolaris({
      apiKey: API_KEY
    }),
  ],
};
Let's review the code above.
- We import the
polarisInterceptorandprovidePolarisfunctions from the@getpolaris.ai/sdk-angularpackage. - We provide the
polarisInterceptorfunction to the Angular HTTP client using thewithInterceptors()function. - We invoke the
providePolarisfunction with the Polaris Application API key.
Create an indicator
An indicator is a metric that you want to track. For example, you might want to track the success/failure rate of an API request. Or, you might want to track core web vitals for your web application.
Core Web Vitals
Note: Core web vitals measurements are automatically sent to Polaris once you connect your application to Polaris.
To create an indicator, navigate to the application indicators page and click the Create Indicator button.
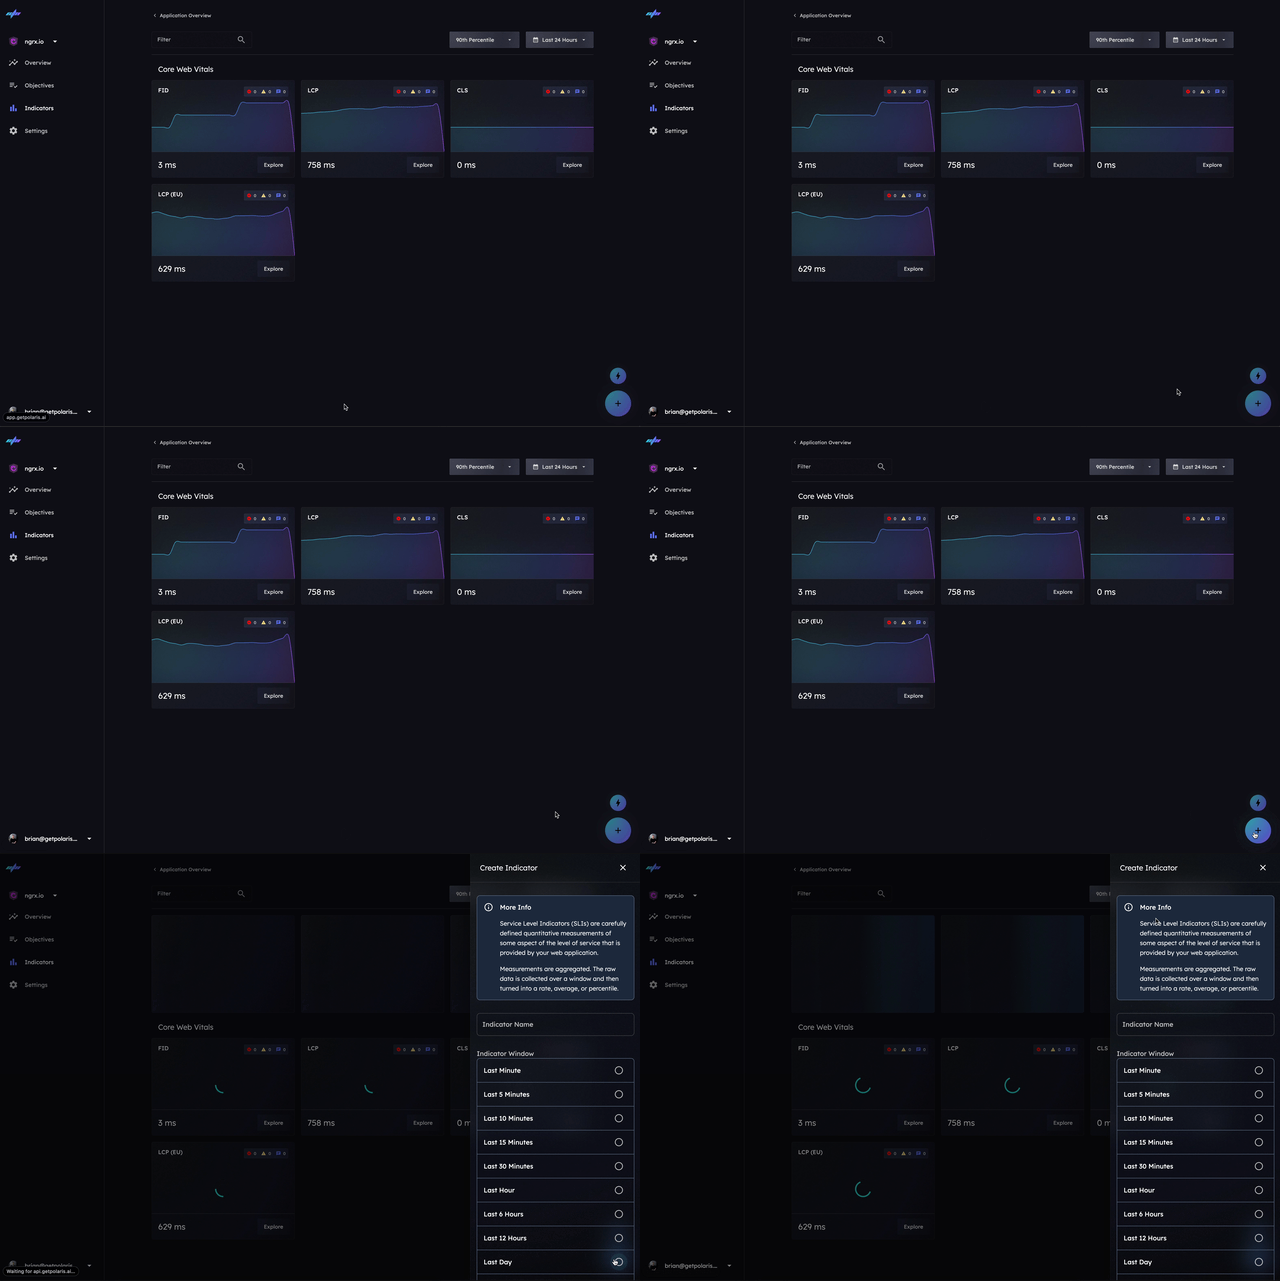
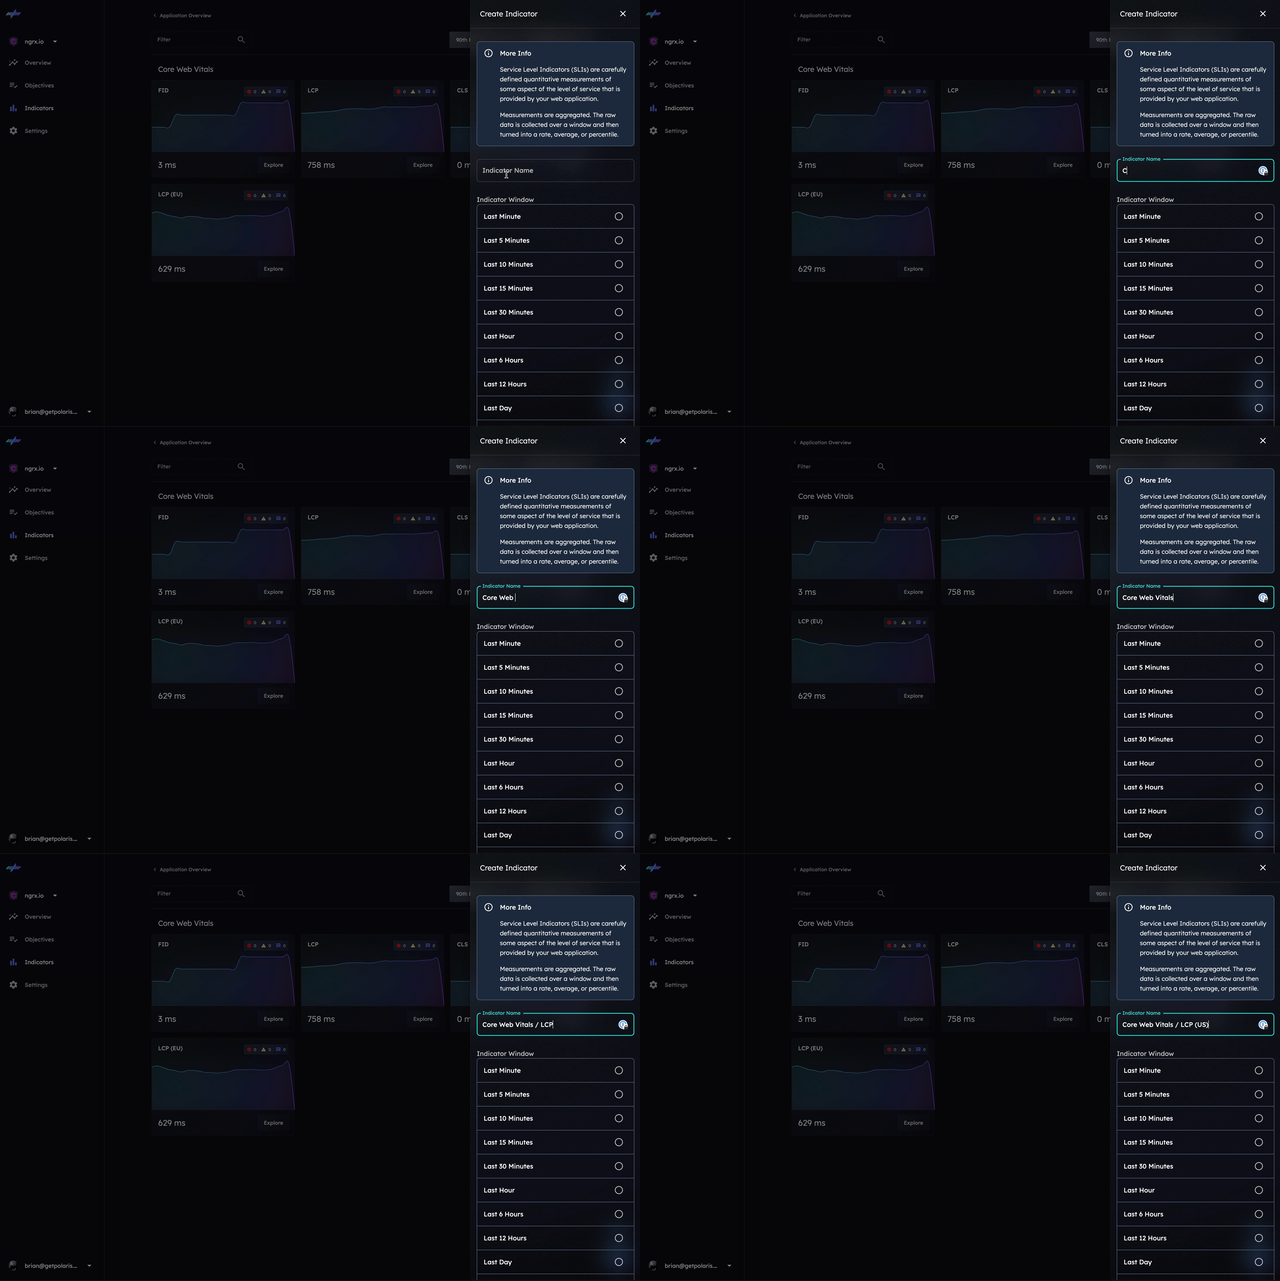
Next, specify a name for the indicator.
Naming Convention
Note: You can use a forward slash (/) to create a hierarchy of indicators.
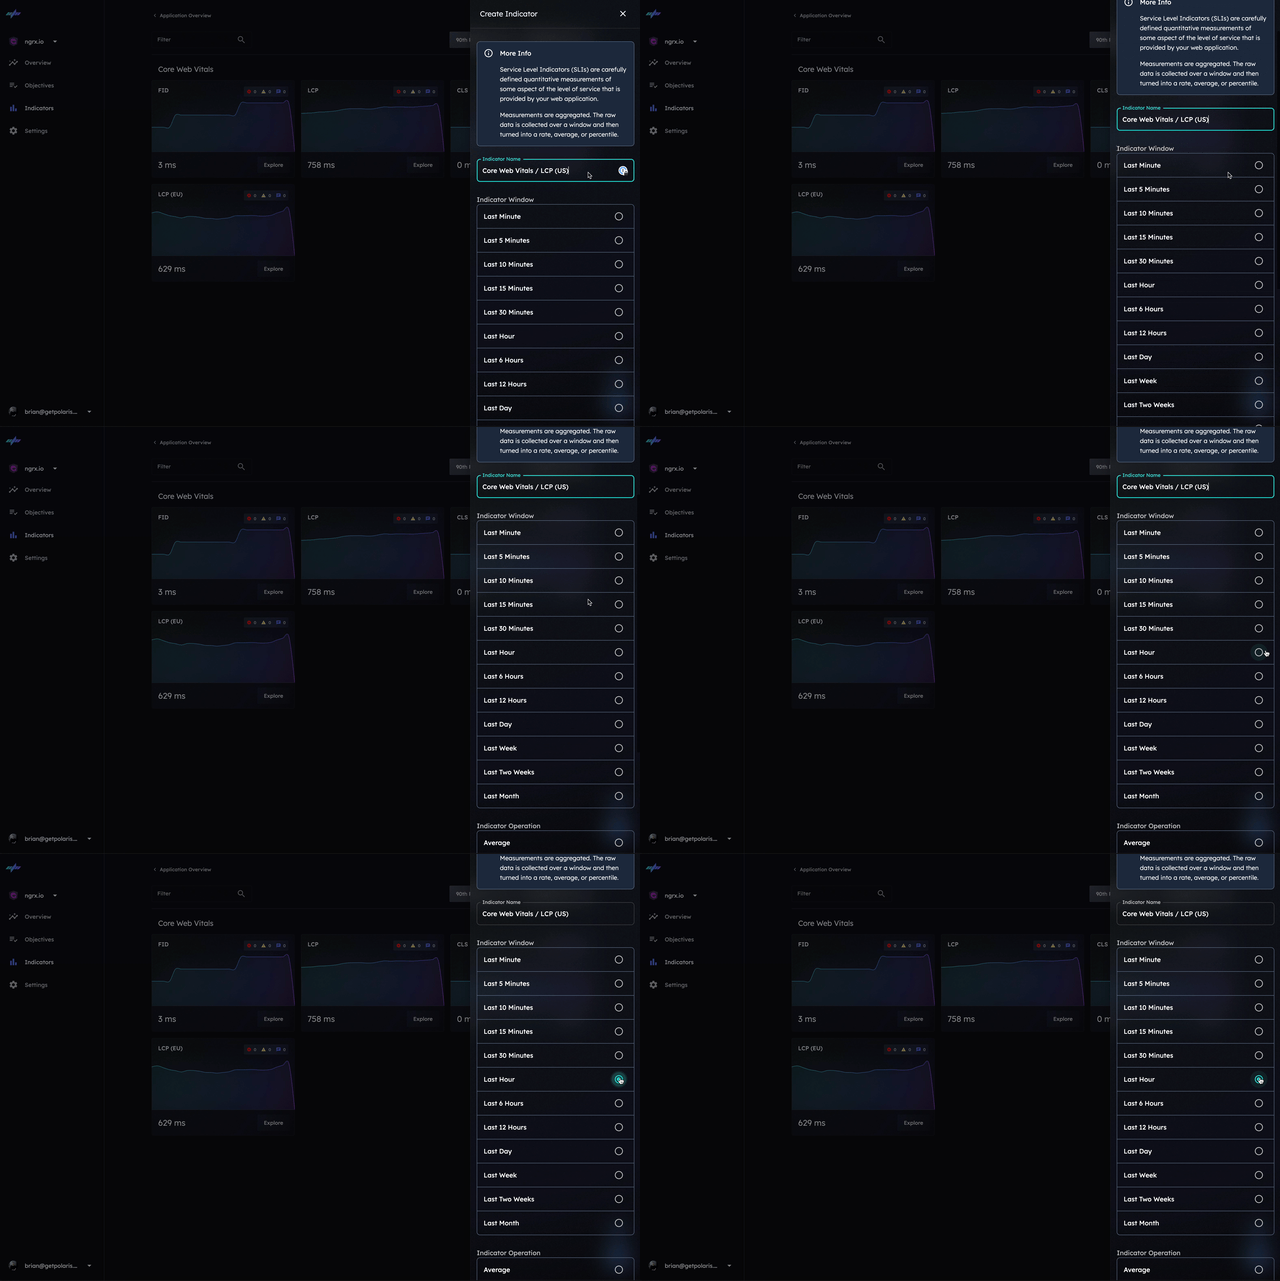
Next, choose the indicator window.
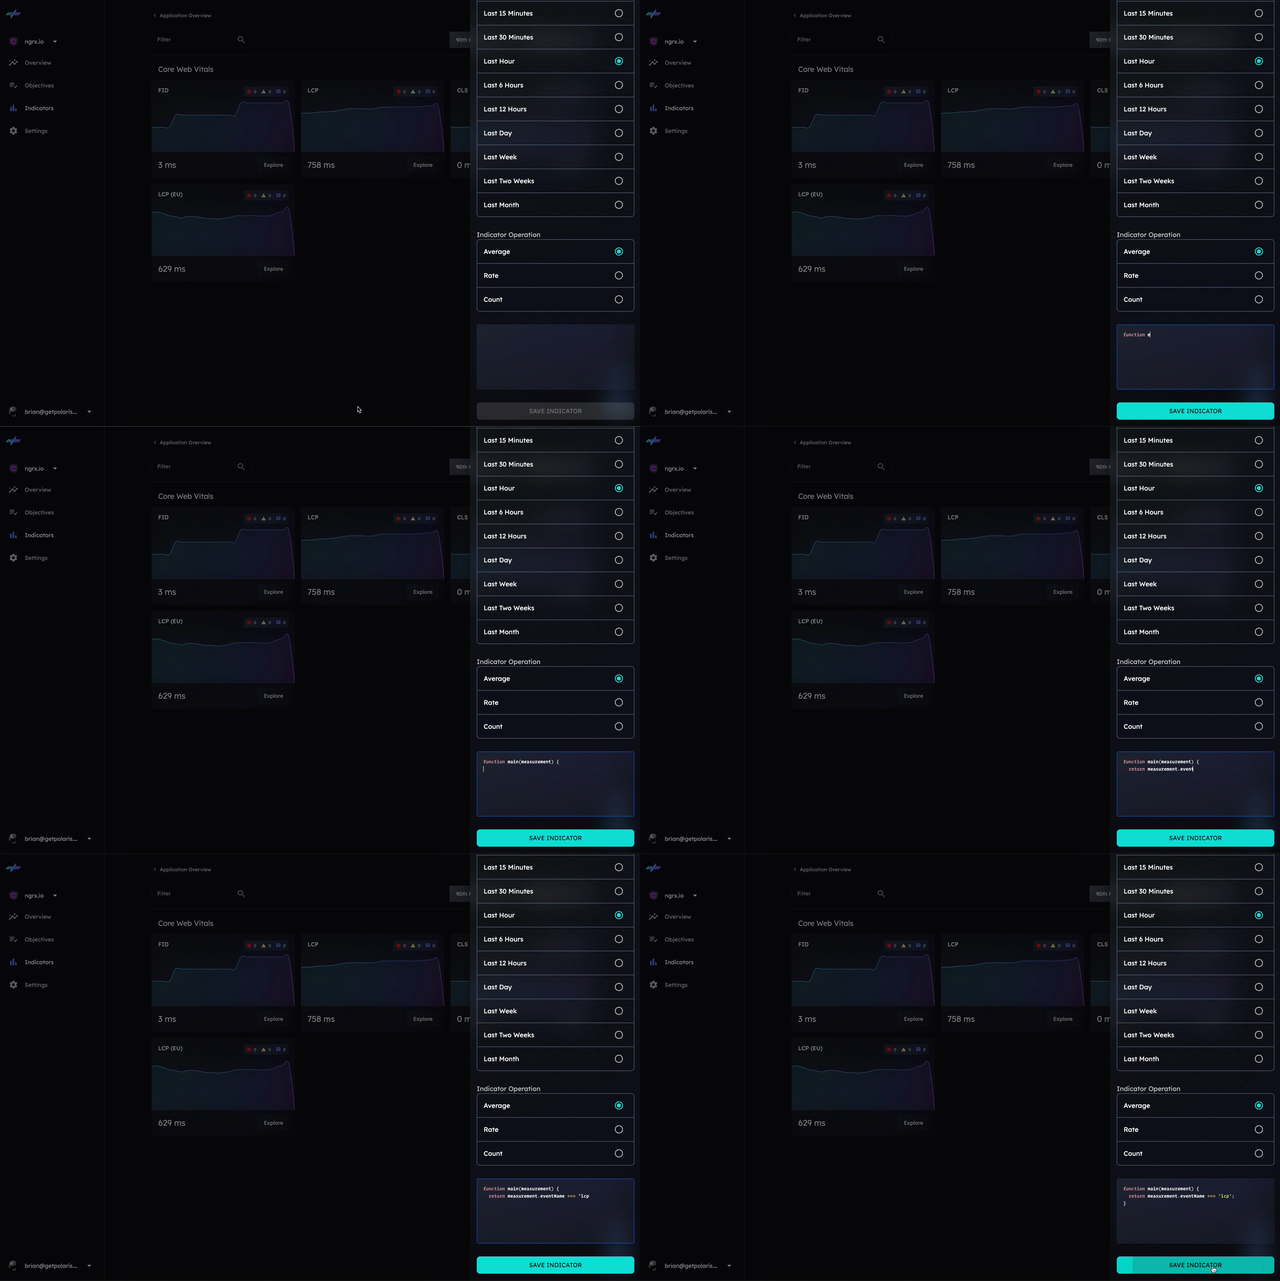
Next, choose the indicator operation.
- Average: The average value of all measurements in the window.
- Rate: The error rate of all measurements in the window.
- Count: The number of measurements in the window.
Finally, we filter all measurements that our application is sending to Polaris using a simple predicate function.
In this example, we'll filter all measurements with the eventName of lcp.
function main(measurement) {
  return measurement.eventName === 'lcp';
}
Create an objective
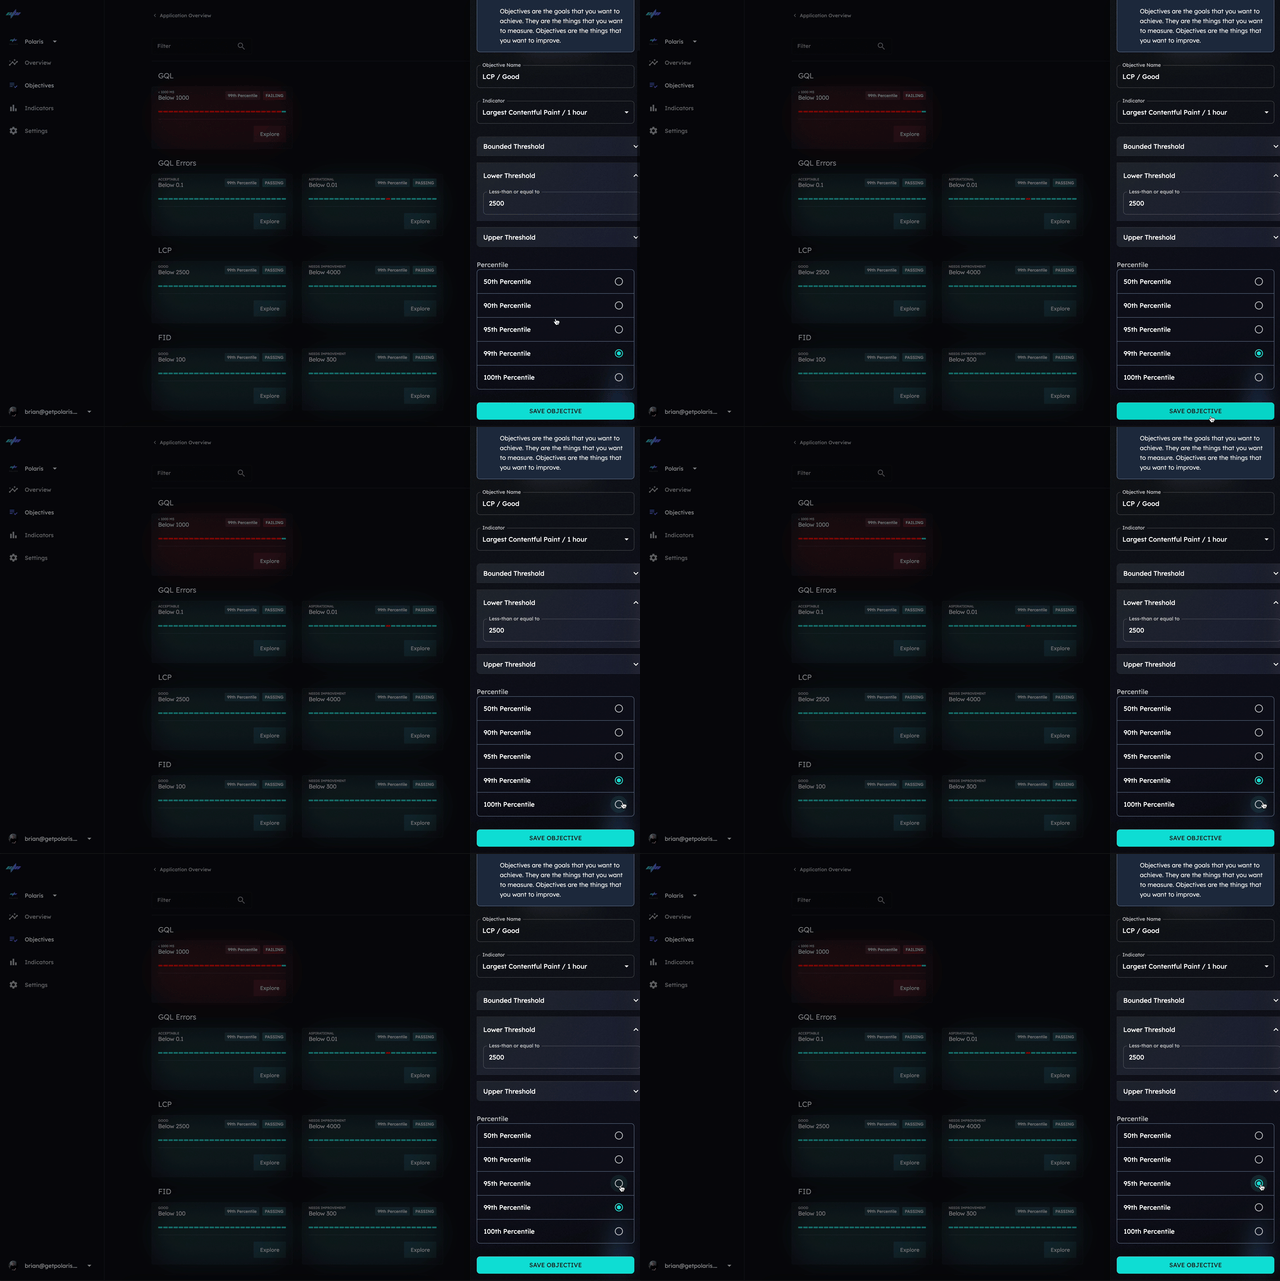
To create an objective, navigate to the application objectives page and click the Create Objective button.
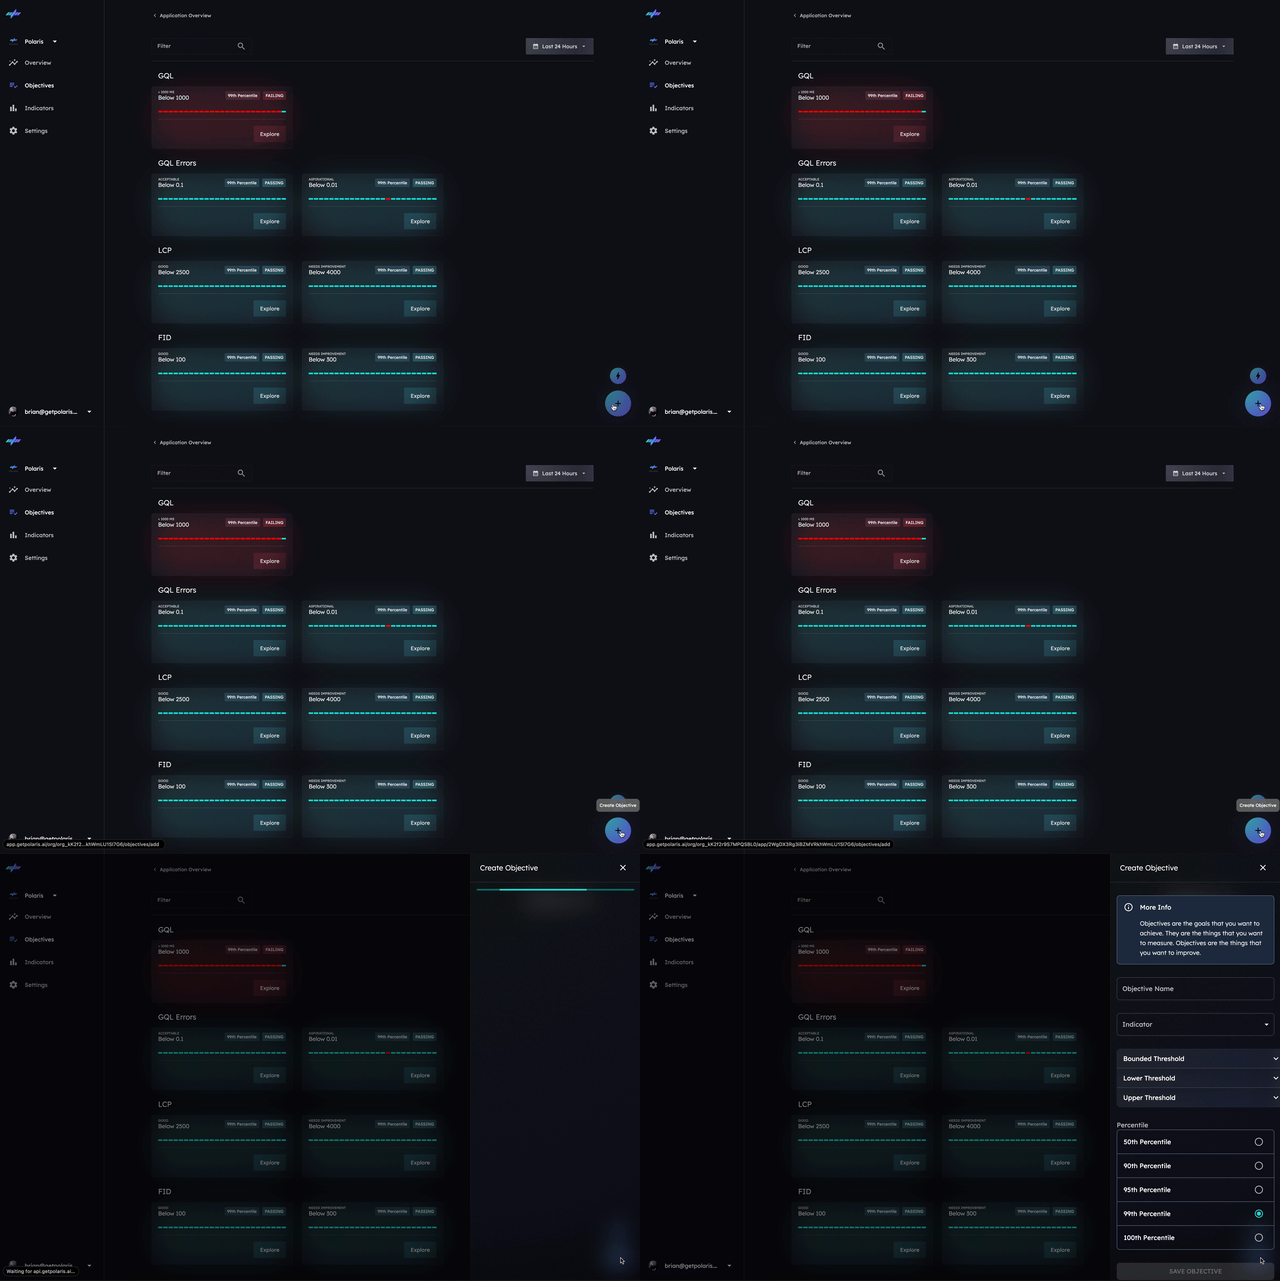
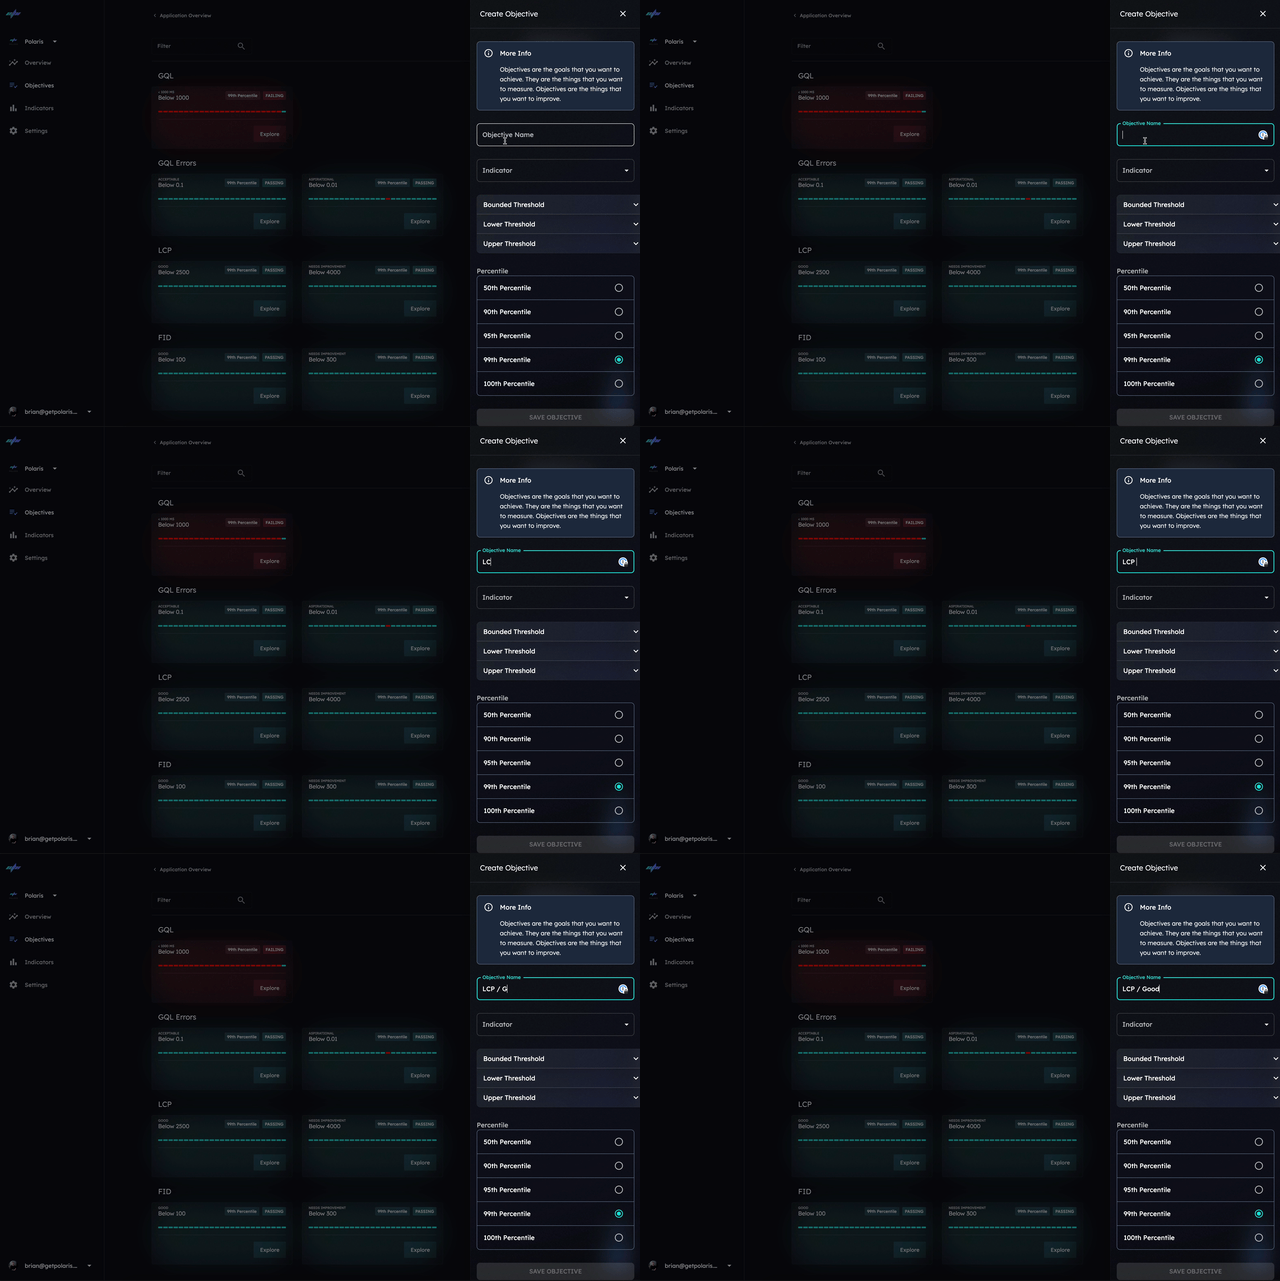
Next, specify a name for the objective.
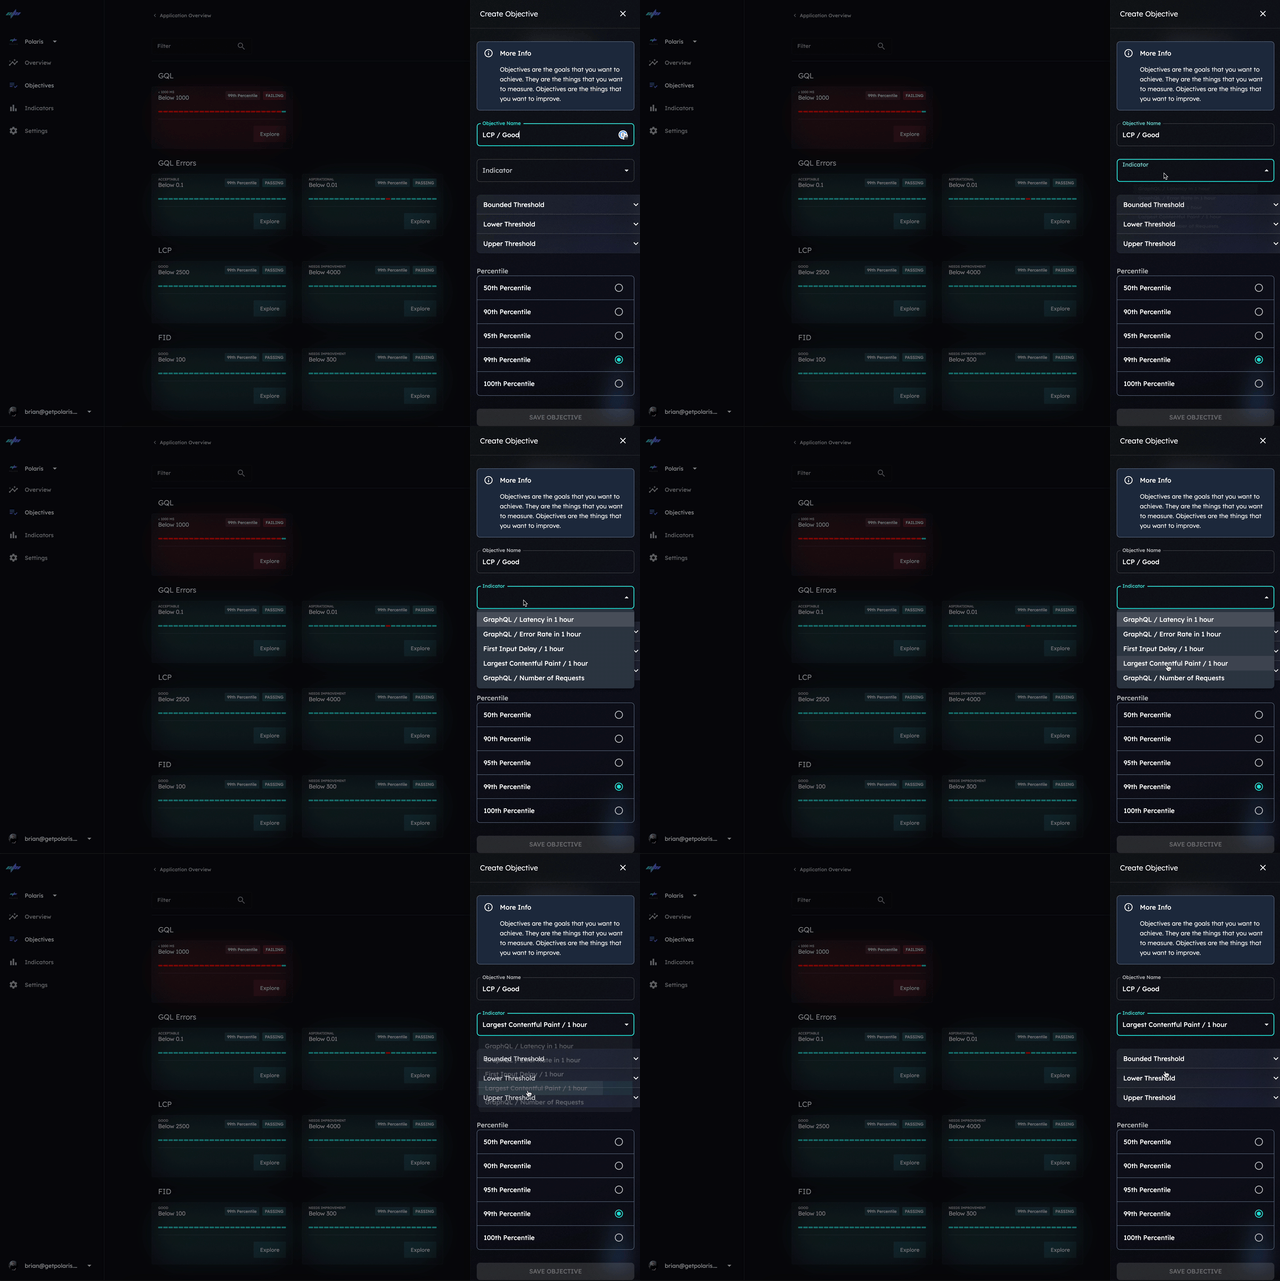
Next, choose the indicator we just created.
Next, choose the appropriate threshold for the objective.
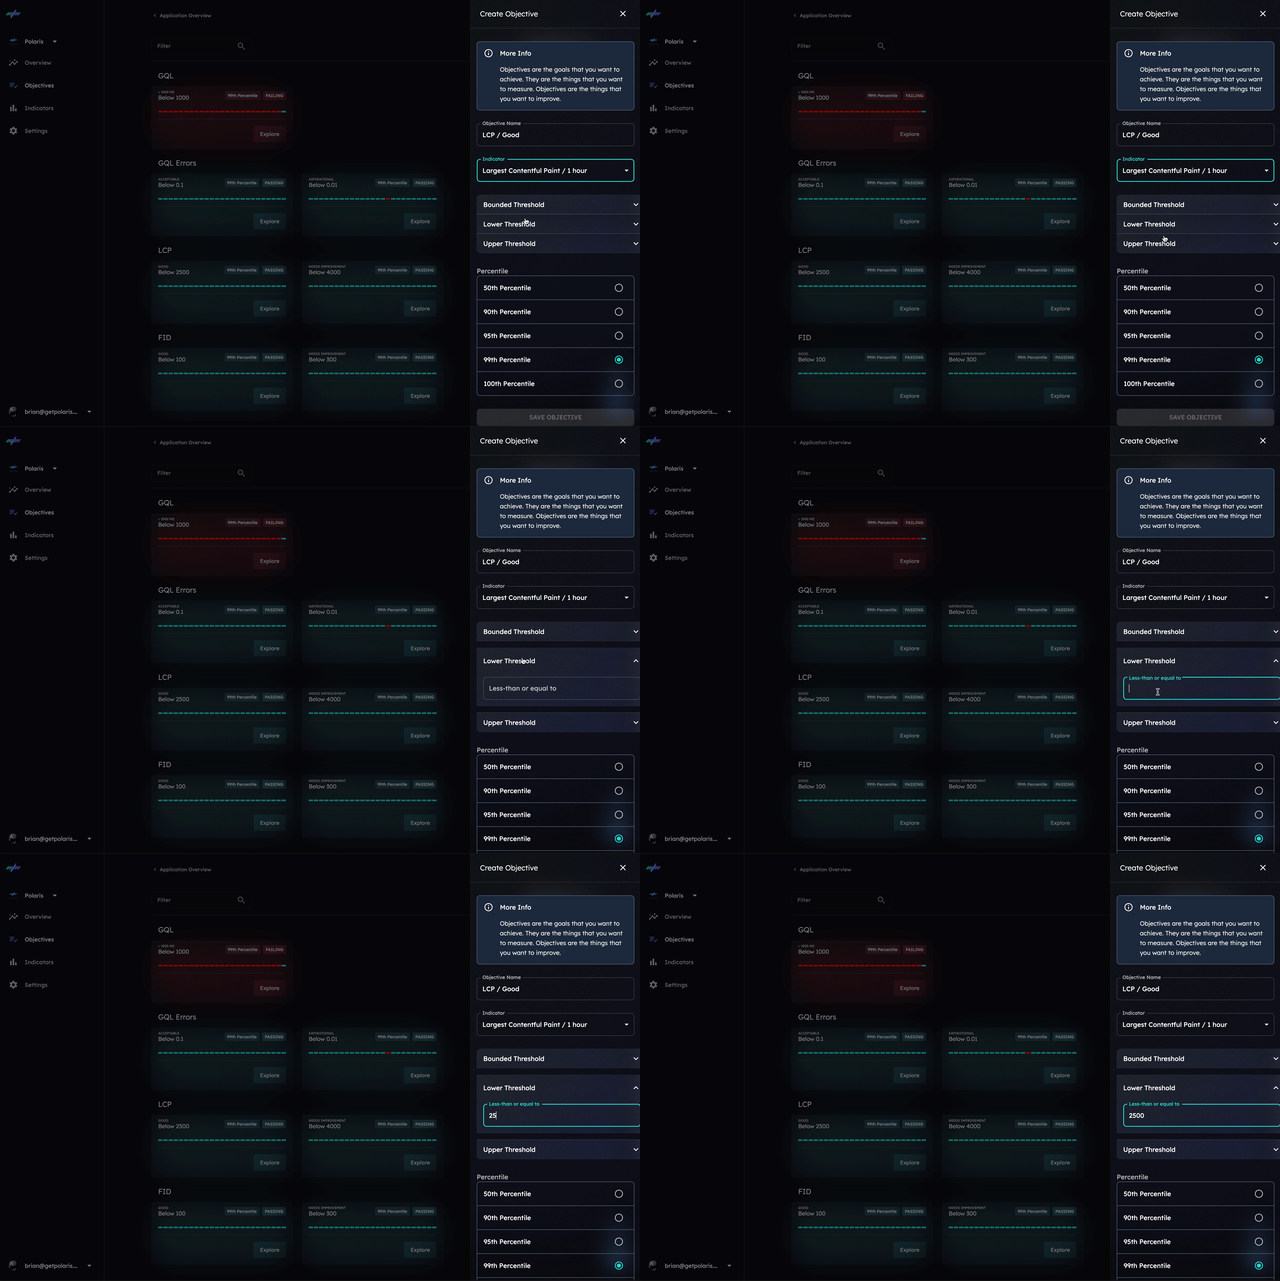
Finally, choose the percentile for the objective.
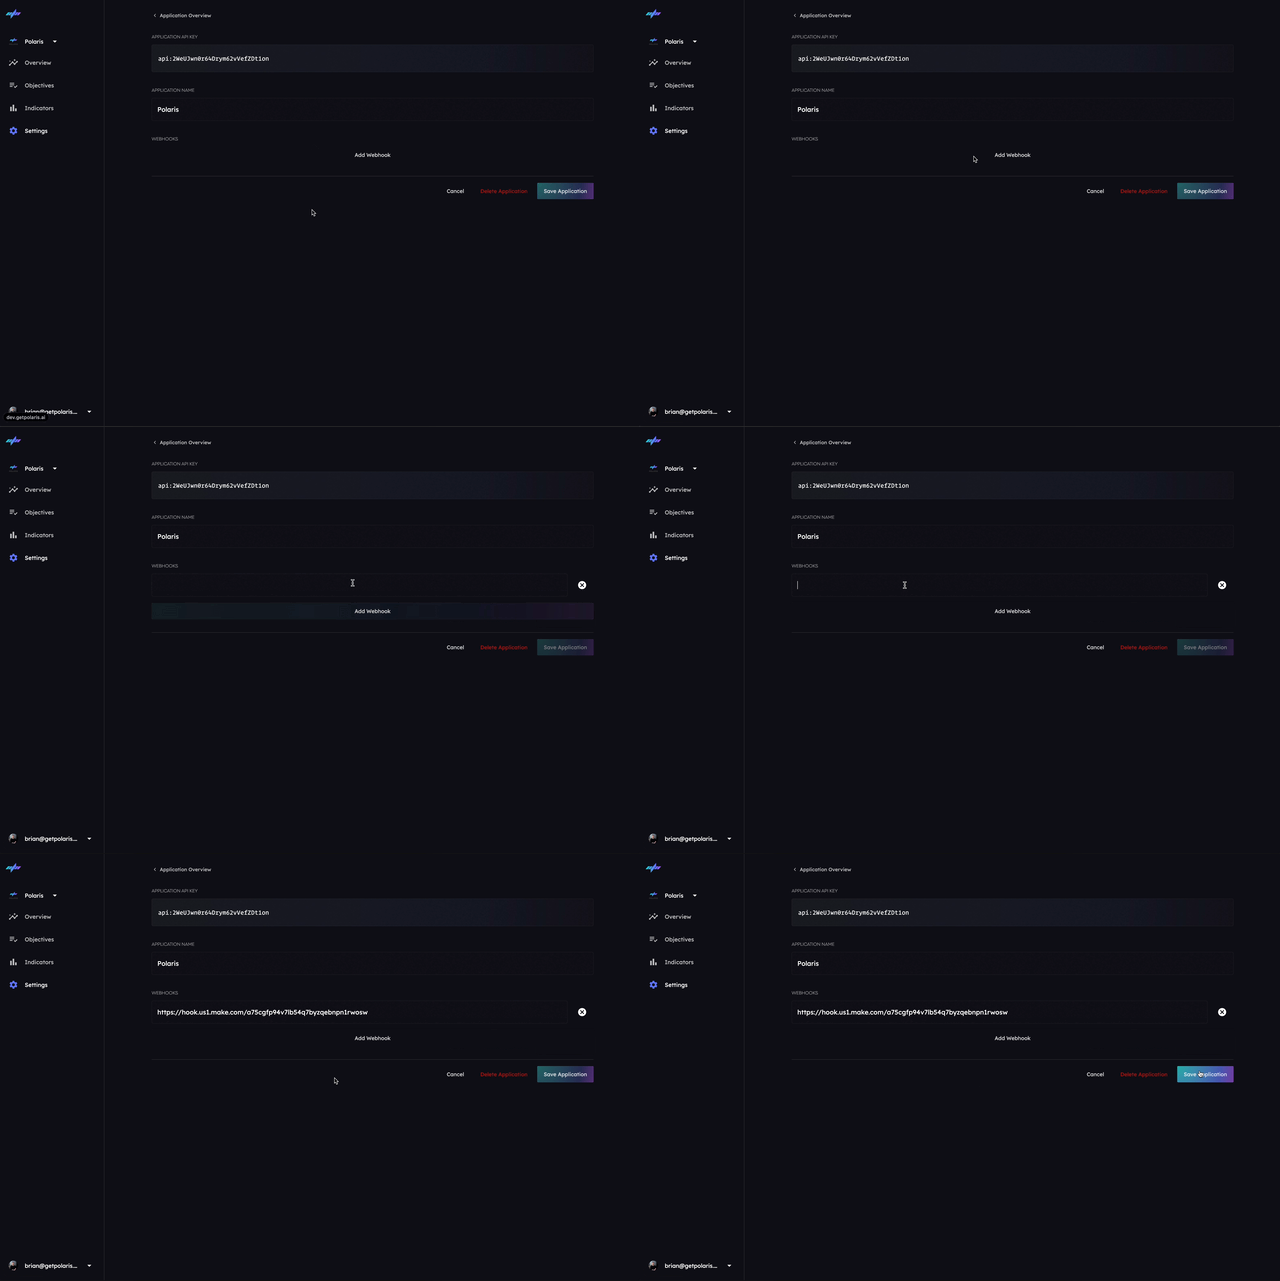
Webhooks
Configure one or more webhooks to be notified when an objective state changes.
The webhook is a POST request to the URL you specify. The body of the request is a JSON object with the following structure:
{
  "event": "ObjectiveStateChange",
  "objective": {
    "id": "2WeUJuj8uImopO9qhgbTZxhuDGM",
    "appId": "2WfoQifyOYe6wmM6fAwFLZvlxep";
    "name": "Auth / Login / Acceptible";
    "state": "FAILING";
    "stateLastUpdated": "2023-12-10T14:16:05.755Z",
    "createdAt": "2023-01-01T00:00:00Z",
    "updatedAd": "2023-01-01T00:00:00Z"
  },
  "state": "FAILING",
  "app": {
    "id": "app-id",
    "name": "app-name",
    "description": "app-description"
  }
  "indicator": {
    "id": "2WeUJuj8uImopO9qhgbTZxhuDGM",
    "appId": "indicator-name",
    "name": "Auth / Login"
    "window": "LAST_HOUR"
    "operation": "AVERATE"
    "createdAt": "2023-01-01T00:00:00Z",
    "updatedAd": "2023-01-01T00:00:00Z"
  }
}
What's next?
Congrats - you're now streaming real-time measurements into Polaris, you have established indicators of performance and reliability and the objectives that you and your team desire to achieve. 🎉